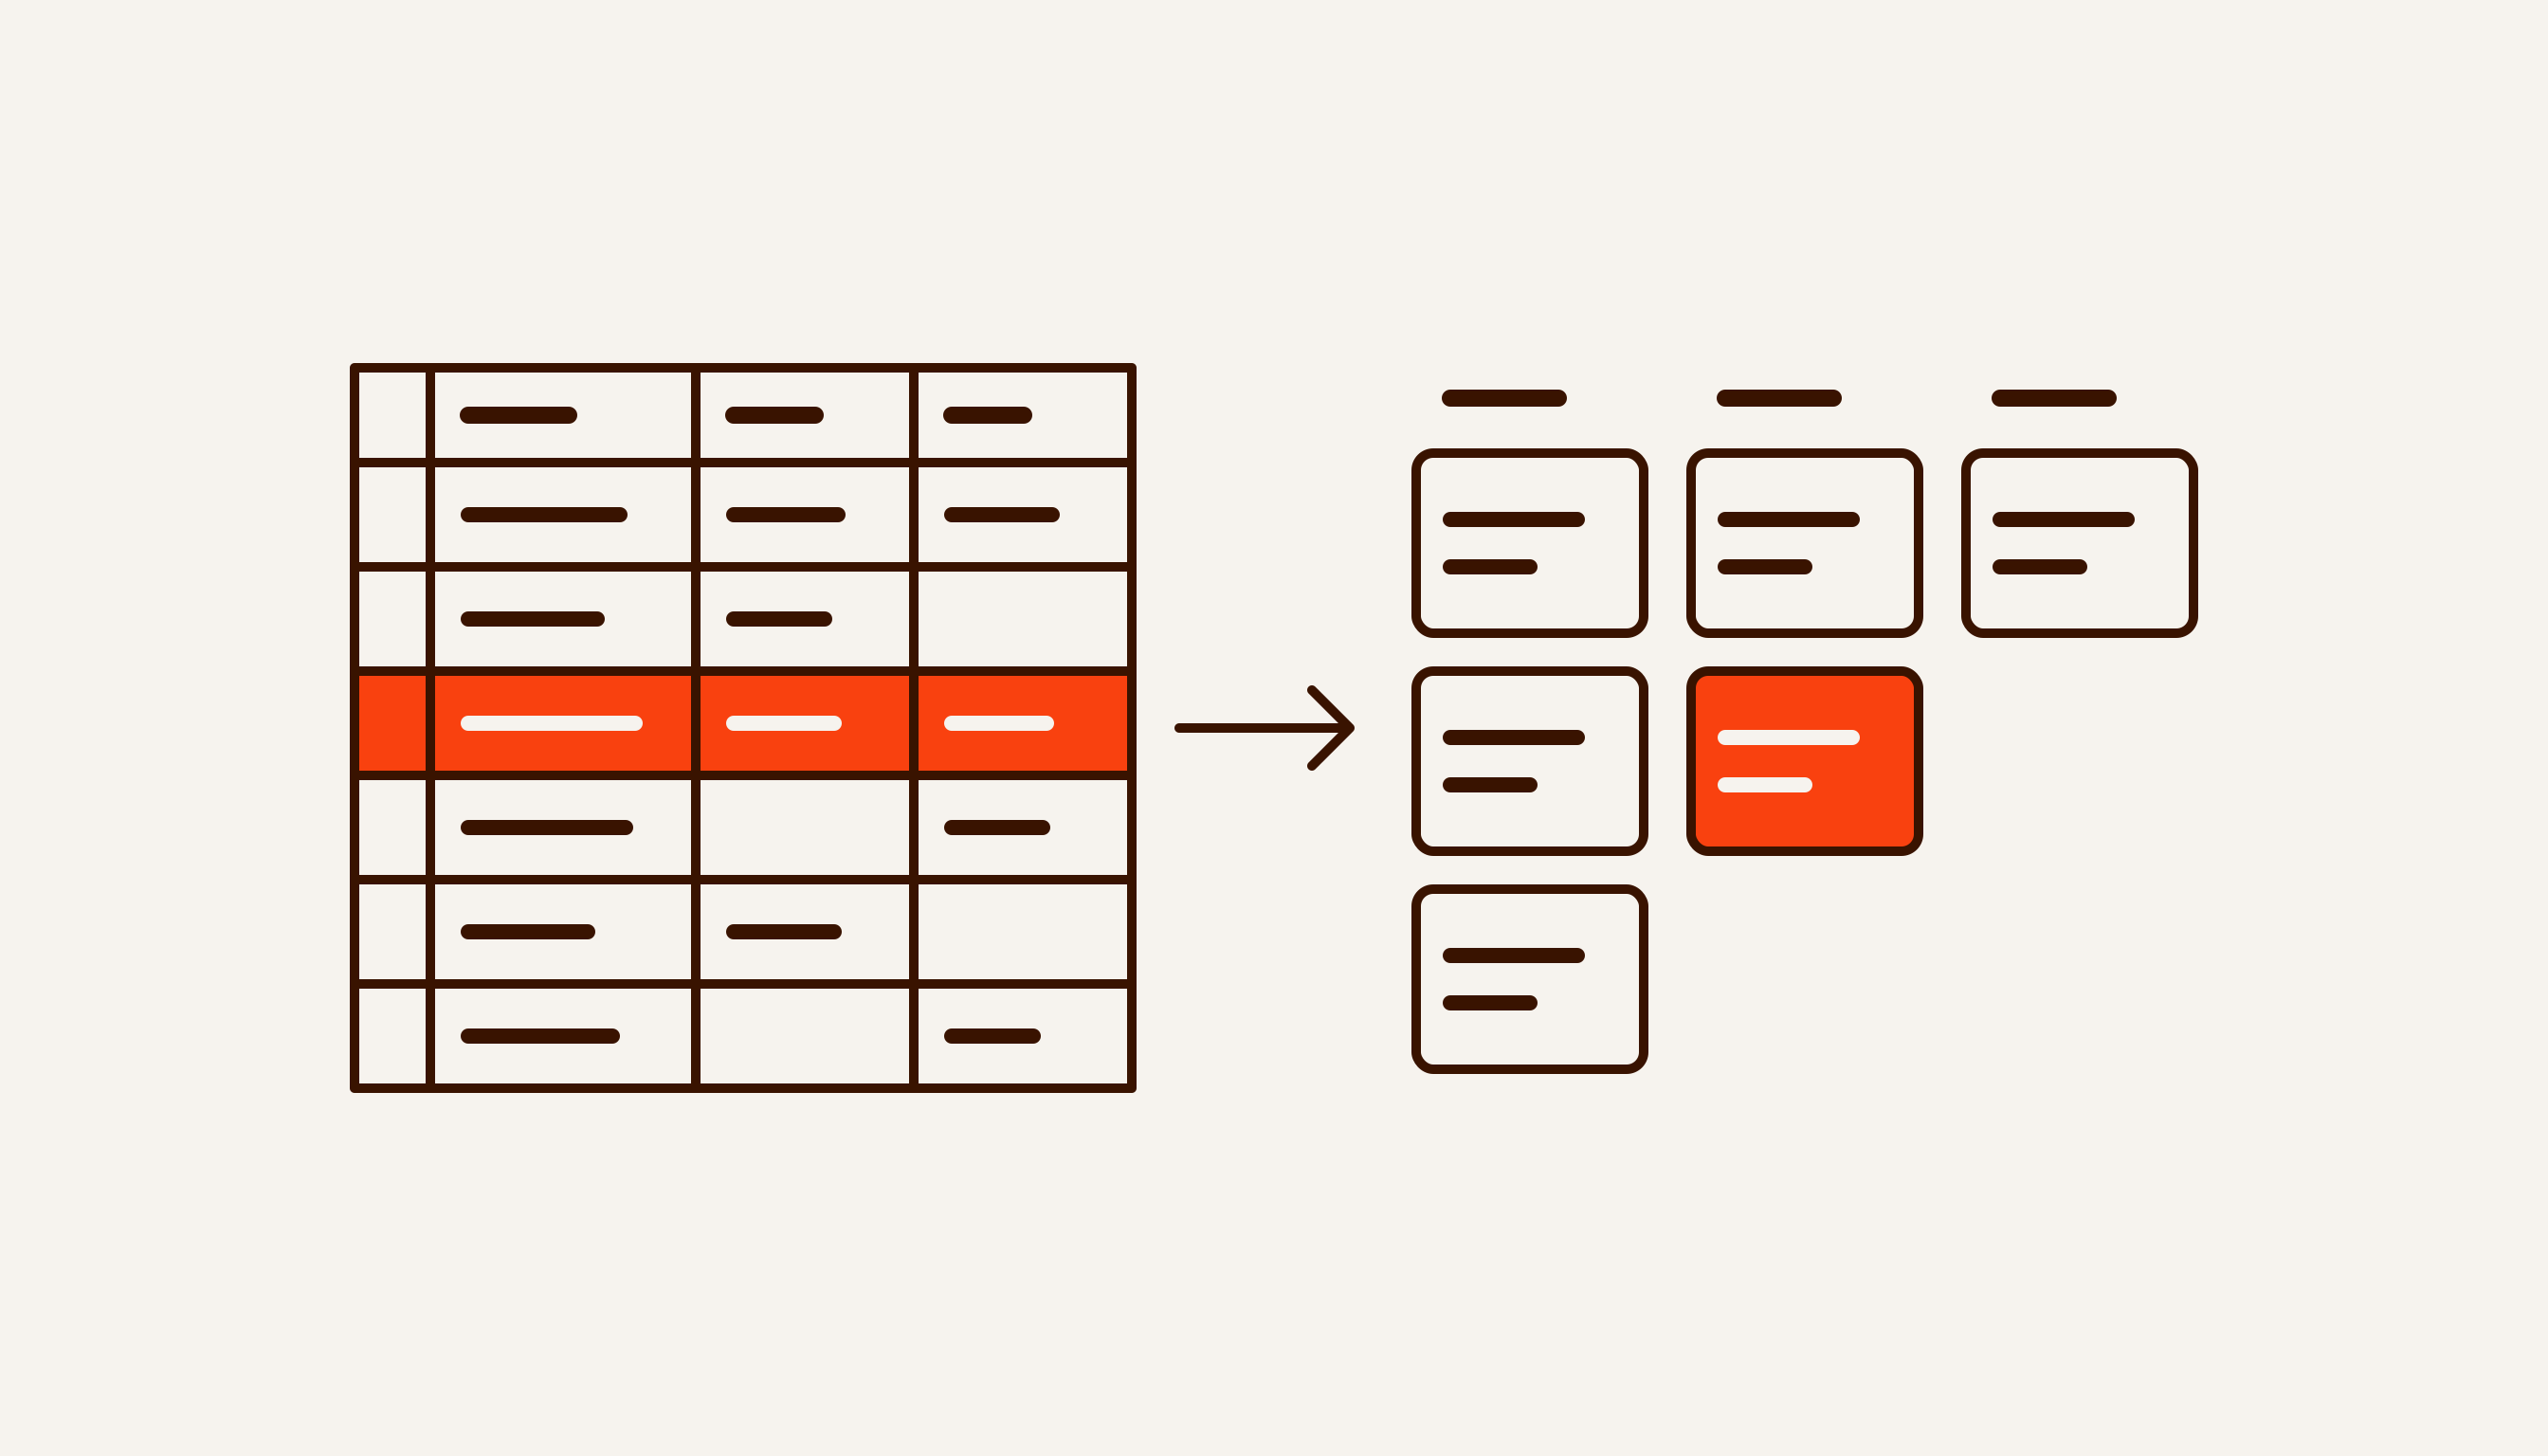

Automated reporting means the numbers pull themselves together from their sources and reach the person who acts on them at the same time every day. The only manual step left is reading and deciding. Finding a tool is rarely the problem — Excel, Google Sheets, a script or a service will do. The hard part is knowing what to automate.
Here is the order of work: which numbers you need and who acts on them, what actually breaks reports, four levels of automation and their limits, where AI fits, a five-line summary template and a checklist.
First decide who will do what with the report
There is no point automating a report nobody acts on. You would be paying to have a useless document arrive on time.
The test is simple. List every line of your current report and fill in three things for each: where the number comes from, who looks at it, and what that person does when the number is bad. An illustrative example for a company that makes furniture or canopies to order:
| Number | Source | Who reads it | What they do when it is bad |
|---|---|---|---|
| Overdue order stages | Order sheet or CRM | Production manager | Calls the foreman, moves the client’s date |
| Debts after delivery | Payments sheet or accounting system | Owner | Asks a manager to call the debtor |
| Leads unanswered for over 30 minutes | CRM or messenger | Head of sales | Finds out who missed them and why |
| Cash in the bank | Bank or accounting system | Owner | Reschedules supplier payments |
Any line with an empty last column goes. What usually remains is three to five numbers. That is enough, and a summary that short fits on one phone screen.
Second rule: each number has one source. If revenue is counted both in the accounting system and in a manager’s spreadsheet and the two disagree, automation will not decide which is right. Settle that before any work starts, and write it down.
Third: next to any number that is easy to improve on paper, put a quality number. Lead response time drops fast when a manager replies “received” and then disappears. Why a measure that becomes a target stops measuring anything is the subject of our article “What gets measured gets managed”.
What actually breaks reports
Reports break in two places: manual copying and silent limits. Copying errors are familiar — the wrong range pasted, a new row forgotten, the wrong week. Silent limits are worse. The system raises no error; it simply drops whatever does not fit, and the report looks normal.
15,841 cases that never made the count
In autumn 2020, Public Health England (PHE) compiled COVID-19 test results for the daily count of new cases in England. On 4 October the agency announced that 15,841 cases from 25 September to 2 October had not been included in the daily figures. PHE put it down to some files of positive results exceeding the maximum file size when they were loaded into central systems.
The BBC filled in the details. Labs submitted results as CSV text files, which caused no trouble. PHE collected them automatically into Excel templates, and its developers chose the old XLS format. A template in that format held about 65,000 rows, and each test result took up several rows, so one template could hold roughly 1,400 cases — anything beyond that was simply left off. A worksheet in current Excel holds 1,048,576 rows.
People still received their test results as normal. Contact tracing is what suffered: the missing cases reached the tracing system late, with all of them transferred by 1 a.m. on 3 October. Afterwards PHE started splitting large files into smaller batches.
The process was automated, and that did not save it. A failure like this can be caught by a check that fits into any report: how many rows came in, and how many made it into the total.
The formula that missed five countries
A similar story comes from the working spreadsheet behind Carmen Reinhart and Kenneth Rogoff’s 2010 paper “Growth in a Time of Debt”. An average formula covered rows 30–44 instead of 30–49, so Australia, Austria, Belgium, Canada and Denmark dropped out of the calculation without a single error message. Thomas Herndon, Michael Ash and Robert Pollin found it in 2013 when they obtained the spreadsheet from the authors and recalculated it (PERI Working Paper 322, Cambridge Journal of Economics); looking only at the final figure, nobody would have seen it.
Four levels of report automation
You can automate a report at four levels: refreshing data in Excel, Google Sheets with a scheduled script, pulling from several systems with delivery to Telegram, and a BI dashboard. Pick the lowest level that does the job — each step up costs more to maintain.
| Level | When it fits | Limit |
|---|---|---|
| Excel and Power Query | Data arrives as exports and files; one or two people read the report | Someone has to open the file |
| Google Sheets and Apps Script | Data already lives in sheets; you need scheduled delivery | Google quotas; CRM and accounting data must be exported first |
| Scheduled build and Telegram | Data sits in several systems; the summary is read on a phone | You need a server and someone who fixes the pipeline |
| BI dashboard | Many reports, sliced in different ways by different people | Someone has to open it; a small team is fine with a summary |
Level 1. How to automate Excel reports with Power Query
Automating Excel reports starts with Power Query. You describe once where the data comes from — an export file, a folder, a database — and how to clean it: drop extra columns, fix date formats, append sheets. Power Query records those steps, so from then on the report is not rebuilt, only refreshed.
The refresh does not need a button. Microsoft describes two modes: when the workbook opens and every set number of minutes. Both are check boxes in the connection properties, on the Usage tab.
The limit of this level: Excel refreshes the data but sends the report to nobody, and the timed refresh only runs while the workbook is open. If the report is for one person who opens the file every morning anyway, that is enough. And save it as .xlsx — the PHE story was about exactly that.
Level 2. Google Sheets: IMPORTRANGE, QUERY and a time-driven trigger
If your data already lives in Google Sheets, formulas can build the report. IMPORTRANGE pulls a range from another spreadsheet; the first time you connect, you have to allow access. QUERY runs an SQL-like query over a range. For example, overdue stages per assignee:
=QUERY(Orders!A:F, "select C, count(A) where F = 'overdue' group by C", 1)
IMPORTRANGE has limits worth knowing up front. A single request is capped at 10 MB of data. Changes in the source flow through to open spreadsheets, and even when nothing has changed, Google’s help page says the function checks for updates every hour while the document is open. Chains of spreadsheets pulling from each other update with delays, and Google advises keeping such chains short.
To make the report send itself, you need an Apps Script with a time-driven trigger, which can run anywhere from every minute to once a month. The script reads the summary sheet and sends an email or a Telegram message. The trigger’s firing time drifts a little, and a regular Gmail account has quotas on script runtime and emails. Ready-made code for the summary and its trigger, with these caveats explained, is in our article on a CRM in Google Sheets.
The limit: all of this works while the data stays in Google. If orders live in a CRM and payments in an accounting system, you have to export them into a sheet first, and the manual step is back.
Level 3. A scheduled build with the summary sent to Telegram
When the numbers sit in different systems, the report is built by a program that runs on a schedule. It pulls data from the CRM, spreadsheets and accounting system via API or export, calculates the totals and sends a short summary to Telegram. The manager reads it on a phone without opening a single app.
A bot sends the summary, and bots have a limit: one message holds up to 4,096 characters. That is a useful constraint. The summary should be short anyway, and the bot can attach the full table as a file of up to 50 MB.
This kind of pipeline is built in code or in n8n, where the schedule is set by the Schedule Trigger node. Check the time zone. The node uses the workflow’s time zone and, if none is set, the time zone of the whole n8n instance. Self-hosted n8n defaults to New York, so an “8:00 summary” will reach Tashkent at 17:00 in summer and 18:00 in winter. What n8n costs and what its licence allows, we covered in a separate article.
A note on 1C, the Russian-made accounting and ERP platform. Its Standard Subsystems Library, which 1C also uses in its own applications, includes a “Report mailing” subsystem. It emails reports, publishes them to FTP or a network folder, and runs on a schedule or at the press of a button (description on the 1C website, in Russian). Your 1C specialist will know whether your configuration has it. If the report lives entirely in 1C and email is enough, start there. A pipeline is needed when 1C figures have to be combined with the CRM or sent to a messenger.
The limit: you need a server and a person responsible for the pipeline. Sources change — the CRM updates its API, a new column appears in a sheet — and the pipeline breaks. That is why the summary needs a data freshness line, more on which below.
Level 4. A BI dashboard when there are many reports
BI makes sense when you have dozens of reports viewed in different cuts: by branch, by manager, by month. Google’s free option is Data Studio — in April 2026, Looker Studio went back to its original name. It connects to Google Sheets and databases and can email a PDF of a report on a schedule.
Each data source in Data Studio has its own refresh rate. Google Sheets defaults to every 15 minutes; Google’s ad products such as Google Ads refresh every 12 hours, and that cannot be changed. If the dashboard is set to “today” and the ad data last refreshed in the morning, you are looking at the morning’s spend.
The limit: someone has to open the dashboard. A small business with a team of five is usually fine with a summary in a messenger, and a dashboard risks becoming one more tab that rarely gets opened.
Where AI belongs in reporting, and where formulas do
The numbers in a report are calculated by formulas, queries and code. Given the same data, they return the same result, and that result can be checked. AI is useful next to the numbers, wherever the input is text:
- sorting managers’ comments or reasons for lost deals into themes;
- transcribing voice messages and extracting facts for the report;
- writing a sentence or two of commentary on numbers that have already been calculated.
Microsoft said much the same. Its help page for Excel’s =COPILOT() function warned: “COPILOT uses AI and can give incorrect responses.” For numerical calculations and any task requiring accuracy or reproducibility, Microsoft pointed users to ordinary SUM, AVERAGE and IF, and advised avoiding AI-generated output in financial reporting. The same page noted that the formula’s results could change over time even with the same arguments (archived copy of the help page, 22 August 2026).
There is a postscript. Since 14 September 2026 the COPILOT function is no longer available: it had been a preview feature. Previously calculated values stay in the workbook, but on recalculation the cell returns a #NAME? error. A report built on a preview function breaks on the day the vendor removes it.
One more rule: no data, no number. If the CRM did not respond, the summary should say “no data from CRM”, not zero and not yesterday’s figure. A zero reads as either good news or a disaster, and either way someone makes a decision based on a number that does not exist.
A five-line summary template
A skeleton for a morning summary you can take and use. The figures and order numbers are made up.
Summary for 29.09, 08:00
1. Overdue stages: 3 (yesterday 5) — workshop: 2, measuring: 1
2. Stuck for over two days: 2 orders — A-1042 "Measuring", A-1057 "Workshop"
3. Owing after delivery: 4 clients — list in the "Debts" file
4. Leads unanswered for over 30 minutes yesterday: 1 of 27
5. Data: CRM — 07:55, payments — 07:58, accounting — no data
What matters here:
- Comparison with yesterday. “3” says nothing; “3, yesterday 5” shows which way things are going.
- Stages and order numbers instead of department totals. The summary should make it clear whom to call without opening a spreadsheet.
- Details as a file or link. The message carries the totals; the full list goes in an attachment.
- A quality line. Line four shows whether speed was bought at the cost of missed leads.
- Data freshness. The last line says where the numbers came from and when they were updated. If a source goes quiet, you see it at once, not a week later.
If nothing happened today, it is better not to send a summary at all. An “all fine” message every morning soon becomes background noise people scroll past.
Checklist before you switch it on
- List the lines of your current report and fill in for each: source, who reads it, what they do. Cross out every line with an empty “what they do”.
- Keep three to five numbers and one quality number.
- Give each number a single source.
- For a week, time how long the manual report takes. That is your baseline.
- Pick the lowest of the four levels that does the job.
- Build in checks: rows in versus rows counted; an update time for every source; “no data” instead of zero.
- Run the automated and manual reports side by side for two weeks, and resolve every difference before you switch the manual one off.
- Name an owner: who fixes it when the summary does not arrive, and who notices first.
If reporting is not your most painful process, see what to automate first. The overall seven-step plan is in “How to automate your business”.
What we don’t know
We quote Microsoft’s warning about the COPILOT function from an archived copy of the help page: the current page no longer carries it. The XLS detail in the PHE story comes from the BBC; the agency’s own statement only mentions a file size limit being exceeded. We could not open 1C’s report mailing documentation on its.1c.ru, which requires a subscription, so the description comes from the 1C website.
Where we stand, honestly
Our own systems send scheduled summaries on their own. CorpVisor runs orders for a manufacturing company in Samarkand and every morning at 8:00 local time sends the director a summary: what is in progress, what is overdue, what has been stuck for more than two days and how much is owed after delivery. If there are no open orders, no overdue tasks and no reminders due today, no summary is sent. The Valli bot sends the owner a daily wrap-up at 21:00 Tashkent time: how many replies and new conversations there were and which customers are hot. It skips empty days too. Valli is currently in pilot.
We do not touch the accounting itself in 1C: entries and built-in reports stay with your accountants. Connecting 1C to a CRM or Telegram we estimate separately for your configuration. We have no measurements of how many hours report automation saves — neither our own nor anyone else’s with a clear method — which is why this article has no savings figures.
How a morning summary works in manufacturing is shown on our page for manufacturers. What a “data from several systems → Telegram summary” pipeline costs is on Business automation with AI: one process end to end, up to three integrations, from $1,200 plus $300 a month.
If you want your report to arrive on its own, describe it in the questionnaire on our home page: which numbers, where they come from and who needs them. The breakdown of one process takes 48 hours and is free.